The “Dashboard” page is the initial page opened upon entering Business Analytics. It is designed to offer a visual overview of your business performance on Amazon on various levels. Business Analytics provides historical data for your Amazon account spanning up to two years, starting from the day you enable the service.
The “Dashboard” page can be accessed in three ways:
- SELLERLOGIC Homepage > Business Analytics
- SELLERLOGIC Homepage > Business Analytics | Dashboard
- Business Analytics navigation bar > Dashboard
Page settings
The “Dashboard” page header offers a range of settings for filtering and configuring the content displayed on the page: “Group/Account”, “Marketplace”, “Date range”, “Product”, “Currency”, and “Edit groups”. For more information about page settings, see Business Analytics | Page settings.
Product filter
The “Search by (SKU, ASIN, Product name)” product filter is unique to the “Dashboard” page. It allows you to search for a specific product and view statistics for the selected product only. The search field requires a minimum of three characters to display the results.
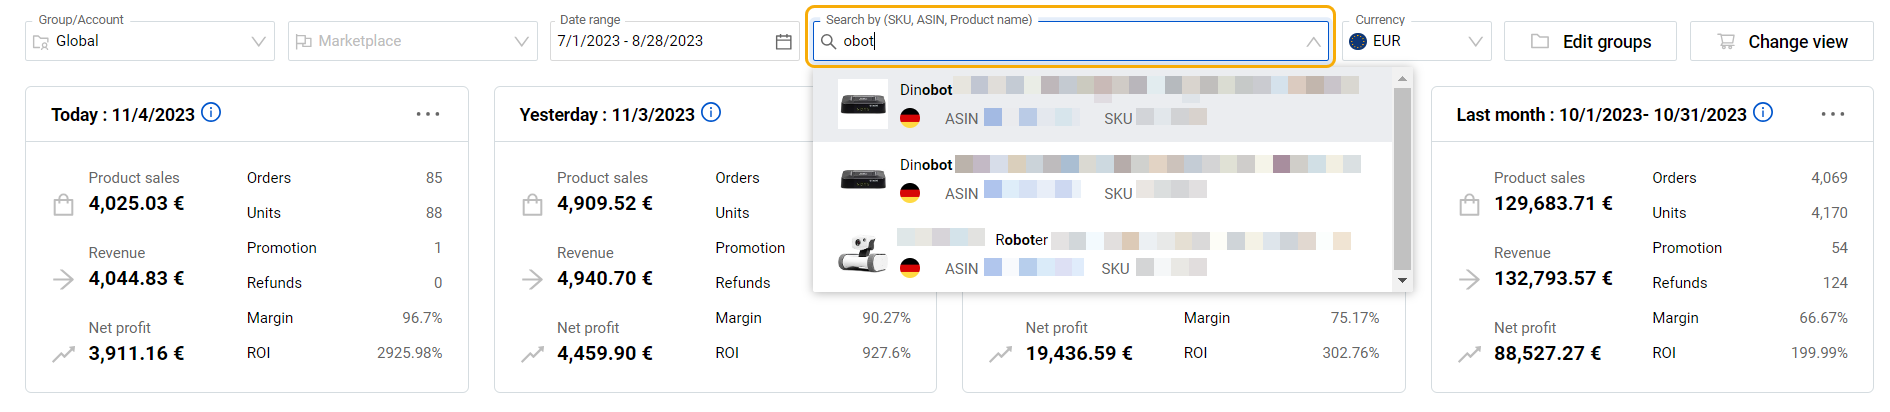
Tip: Clicking on the product ASIN within the search results will open the product page on Amazon. Clicking on the product SKU will paste it into the search field, replacing the current value.
Change view
The “Change view” button located in the top right of the “Dashboard” page reflects the view mode currently selected for the page:
Order view
The “Order view” is a default view mode and is represented with the cart icon. It displays data according to customer order dates. When the “Order view” is enabled, the system assigns transactions to their corresponding order date once it receives this order transaction information. This means that historical data may change with time since transactions related to an order may occur later than the order placement date.
For example, let's say a customer receives an order on January 1, 2023, and the transaction related to this order occurs on January 15, 2023. In the “Order view”, this transaction will be assigned to January 1, 2023, which is the order date, once the system receives this order transaction information (January 15, 2023). This ensures that the data is displayed in accordance with customer order dates.
Transaction view
The “Transaction view” is a view mode that displays data according to actual transaction dates. It is represented with two arrow icons. This view can be enabled by clicking the "Change view" button and selecting "Transaction view" mode. When the “Transaction view” is enabled, the system assigns transactions to their corresponding transaction date. This means that the data is displayed in accordance with the actual transaction dates, regardless of when the order was placed.
For example, let's say a customer receives an order on January 1, 2023, and the transaction related to this order occurs on January 15, 2023. In the “Transaction view”, this transaction will be assigned to January 15, 2023, which is the actual transaction date (January 15, 2023).
Note: The data shown under the “Orders”, “Units”, and “Promotions” metrics is linked to order dates regardless of the “Dashboard” view mode. Thereby, these values do not change when the view mode is switched.
KPI widgets
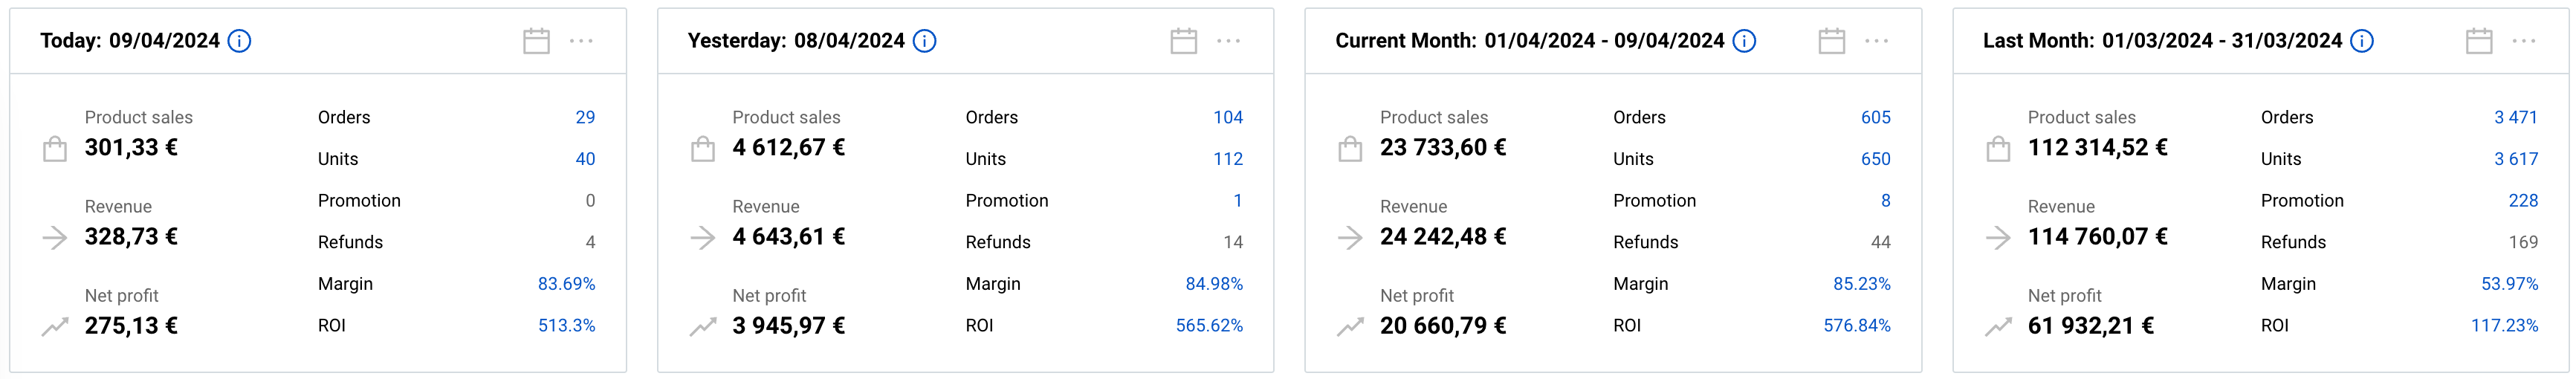
Key performance indicator (KPI) widgets summarize the main performance metrics in four-period blocks displayed at the top of the page: “Today”, “Yesterday”, “Current month”, and “Last month”. The date displayed by the widget can be customized by clicking on the “Calendar” icon on the top right corner of each widget. You can choose a date from the list of presets. Hover over the info icon in a block header to see the date and time of the latest update of a widget data. For more information about the metrics, see Dashboard | Metrics.
Tip: Clicking on the values of the metrics: “Orders“, “Units”, “Promotion” and “Refunds“ will take you to the pre-filtered “Orders” page in a separate tab with a pre-selected date range, accounts, marketplaces, and currency which you have chosen on the Dashboard.
Profit breakdown
To explore the details of the profit breakdown for a specific period, click on the three dots icon within the header of a corresponding period block and select “Profit breakdown”. This action will open the modal form with additional details of your profit breakdown by metrics as described in Dashboard | Metrics. The “Profit breakdown” modal form could also be opened by clicking on the “Margin” and “ROI” buttons.
Sales history chart
The sales history chart visualizes sales data as a continuous line, representing the changes in metrics over time. The horizontal X-axis displays the time period determined by the “Date range” page header filter. The left vertical Y-axis presents amount values (revenue and expenses) for the chart bars in the currency determined by the “Currency” page header filter. The right Y-axis presents quantity values for the chart bars.
Tip: Hover over the info icon at the top right of the chart to see the date and time of the latest update of chart data.
Switch period view
Switch between three period tabs “Day”, “Week”, and “Month” located at the top right of the chart to change the period view. The chart will then display data accordingly on a daily, weekly, or monthly basis.
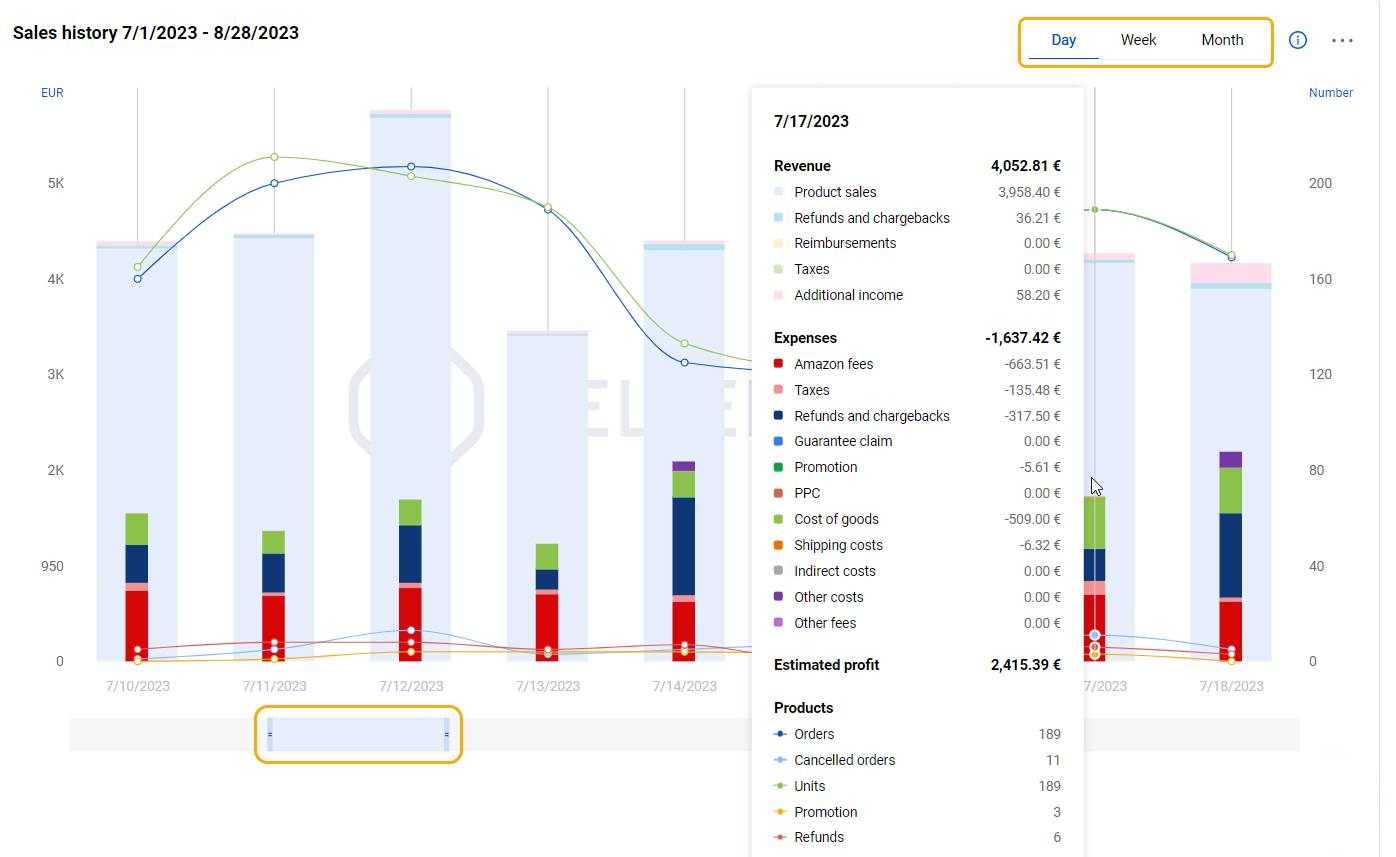
You can resize the scrollbar located under the chart bars to scale the chart period within the limits determined by the “Date range” page header filter. Drag the scrollbar left or right to change the start and end dates without changing the period range.
Chart bars
The chart bars visualize the metrics details under the following categories: “Revenue” (colored in pale), “Expenses” (colored bright), and “Products” (represented as lines).
Chart settings
To access chart settings, click on the three dots icon and select one of the following options:
- “Manage view”: Customize the view of the chart bars by adding or removing specific metrics. To restore the default view, click "Reset".
- “Export data”: Download the current view of the chart in CSV or XLSX file formats.
- “Download chart”: Download the current view of the chart in PNG or PDF file formats.
Sales history chart legend
The sales history chart legend located to the left of the chart provides metric values for the entire period determined by the “Date range” page header filter. To see the metric values for a specific time, hover over the corresponding chart bar in the “Sales history” chart.
To add or remove the specific metric from the chart and the total value calculation, check or uncheck the corresponding checkboxes within the chart legend.
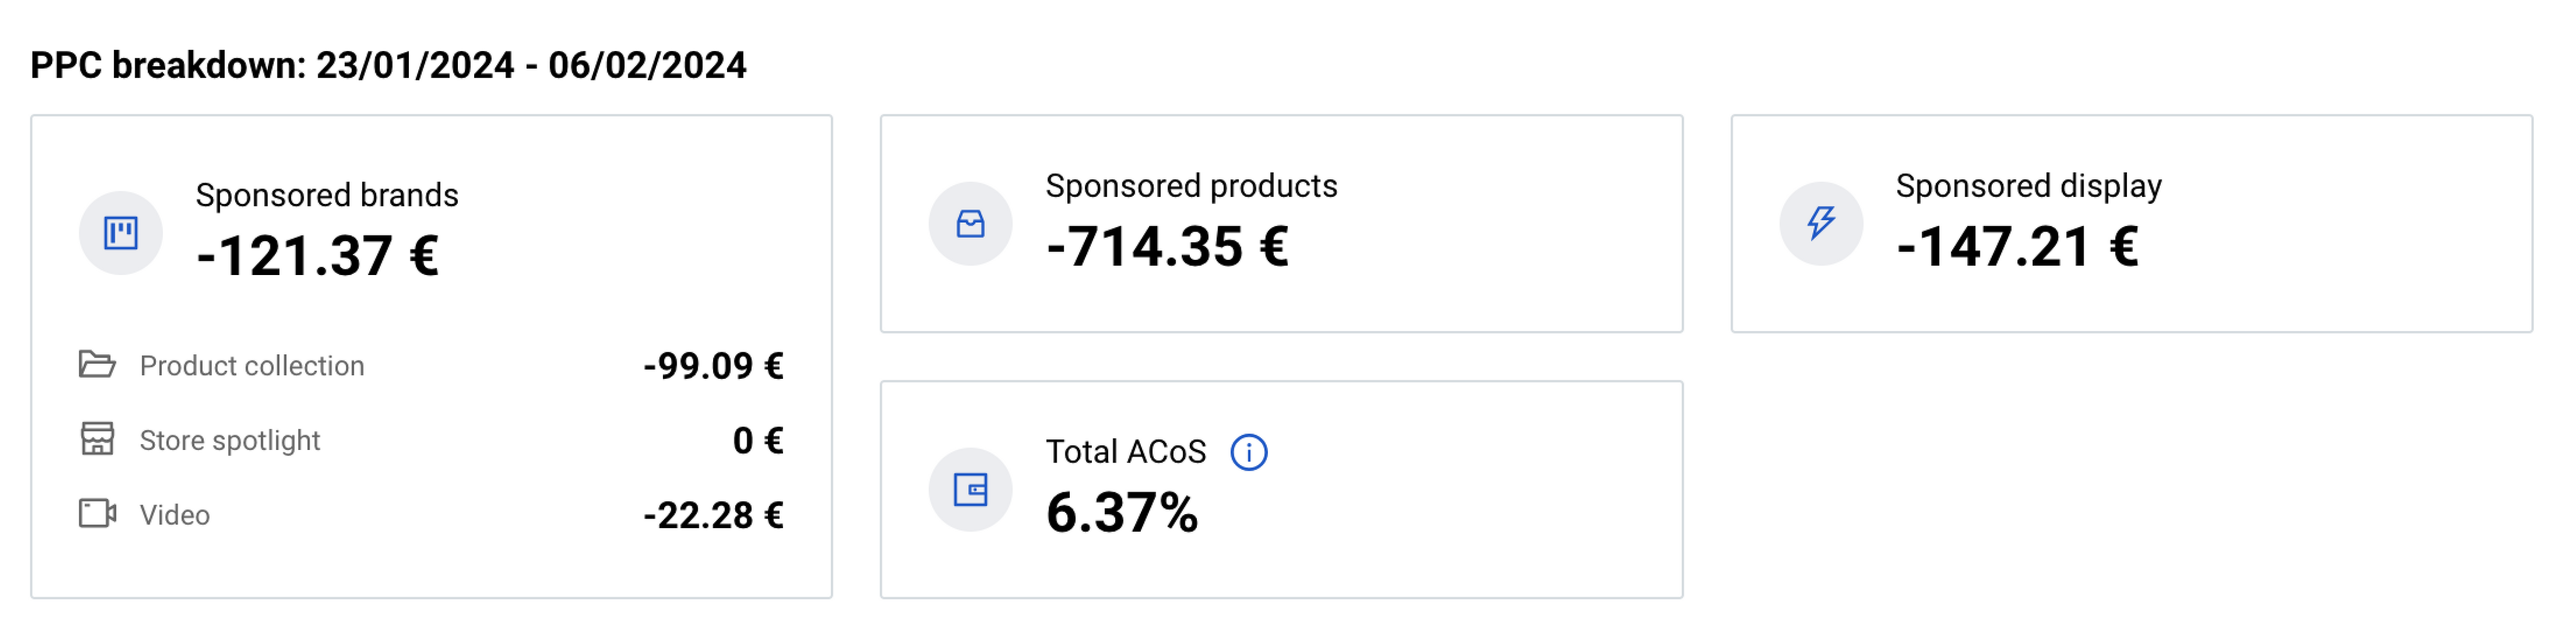
PPC breakdown
The "PPC breakdown" widget located at the bottom of the "Dashboard” page provides you with detailed insights into the costs associated with your PPC (Pay-Per-Click) advertising campaigns on Amazon. The widget presents PPC costs based on the parameters chosen in the page header settings. For more information, see Page settings.
If you have no Amazon Ads account connected to the SELLERLOGIC Platform, the "PPC breakdown" widget will display only zero values for all PPC costs. You will be prompted to connect your Amazon Ads account via the tooltip, which provides a direct link to the "Amazon Ads account management" page.
The "PPC breakdown" widget categorizes PPC costs into the following types:
Sponsored brands: Represents the total costs spent on Amazon advertising for all products sold within the specified period.
- Product collection: Denotes costs spent on advertising curated collections or groups of products to target specific customer segments or showcase related items together.
- Store spotlight: Indicates costs spent to promote the entire store or a selection of products on Amazon.
- Video: Represents costs involved in advertising through video content.
Sponsored products: Represents the total costs spent on the promotion of individual products sold within the specified period.
Sponsored display: Denotes the total costs spent by advertisers to target and reach potential customers across the purchase journey on and off Amazon for all products sold within the specified period.
Total ACoS
The "Total ACoS" (Advertising Cost of Sales) represents the ratio of total advertising costs to total sales. The corresponding tooltip appears when hovering over the info icon. The "Total ACoS" is calculated using the following formula: Total ACoS = (PPC costs ÷ Revenue) x 100.
Info: The widget retrieves historical data for PPC costs. Its span starts from the day the service was enabled and differs for all categories:
- Sponsored brands: 60 days
- Sponsored products: 95 days
- Sponsored display: 65 days
Metrics
Below is a table listing all metrics available on the “Dashboard” page, along with their respective descriptions.
| Metric | Description |
|---|---|
| Revenue | The total income that includes product sales and other income. |
| Product sales | The amount of income generated by ordered product sales. |
| Refunds and chargebacks | Refund and chargeback transactions that generate income. |
| Reimbursement | Reimbursement transactions that generate income. |
| Taxes | Tax transactions that generate income. |
| Additional income | Miscellaneous transactions that generate income. |
| Expenses | The total amount of costs and expenses. |
| Cost of goods | The cost spent to procure products for selling. Note: Cost of goods is provided manually on the “Product costs” page or through import. |
| Shipping costs | The shipping costs can be assigned for FBM products manually on the “Product costs” page or through import. |
| Indirect costs | The costs that are not directly associated with individual products or specific transactions but instead represent broader operational and administrative costs. |
| Amazon fees | All Amazon orders and non-orders-related fees. |
| Other costs | Miscellaneous costs reported by Amazon. |
| Other fees | Miscellaneous fees assigned to the product. Note: Other fees are provided manually on the “Product costs” page or through import. |
| Taxes | Amazon transactions and VAT that can be assigned for FBM products manually. |
| Refunds and chargebacks | The cost spent on chargebacks and refunded products. |
| Guarantee claim | The cost spent on guarantee claims. |
| Promotion | The cost spent on promotions and discounts. |
| Estimated profit | The amount of estimated net profit, calculated as revenue minus total expenses. |
| Margin | The percentage of the net profit in the revenue. |
| ROI | The ratio of net profit over the total expenses. |
| Products | The product-related metrics. |
| Orders | The number of all orders. |
| Canceled orders | The number of orders that were canceled before being fulfilled. |
| Shipped orders | The number of orders that have been successfully processed, and dispatched for delivery to the customers. |
| Units | The number of ordered units. |
| Promotion | The number of orders with promotions applied. |
| Refunds | The number of refunded units. |